INDUSTRIAL OBSERVABILITY.
ONE PANE OF GLASS.
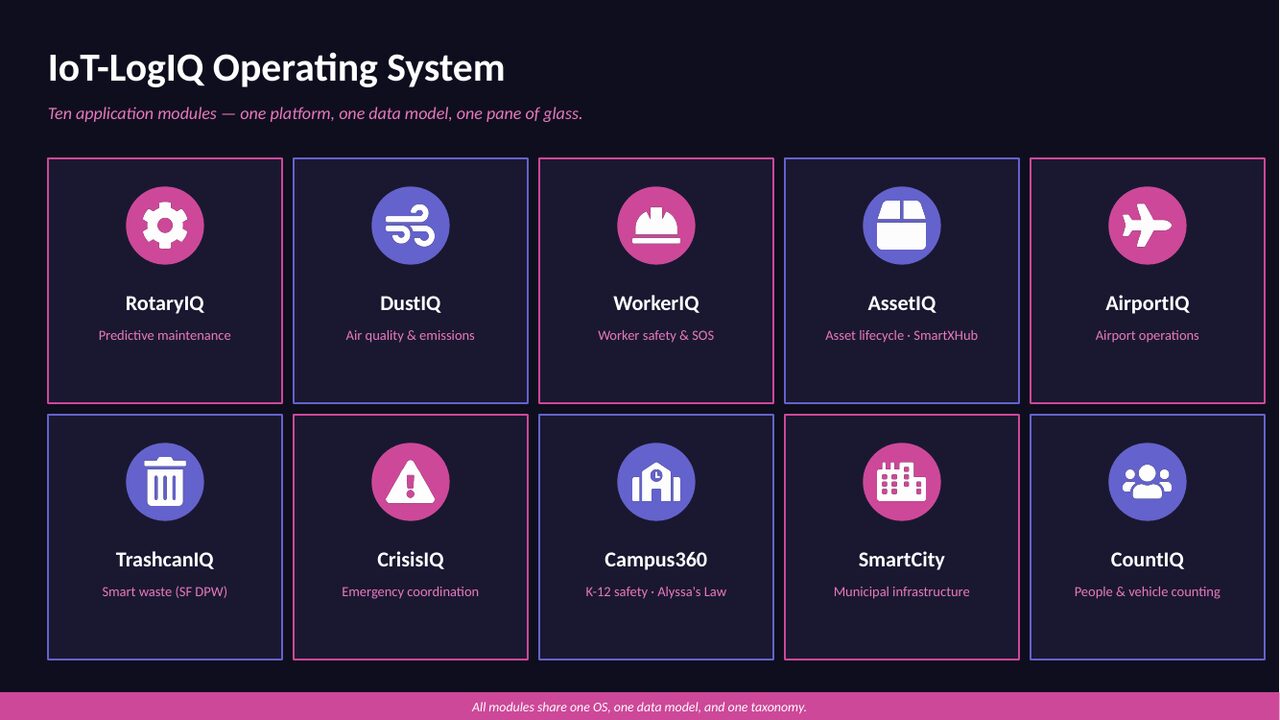
Every sensor, every asset, every area, every system, every plant, every tenant — in one application. Built on the Smart Industry Taxonomy and powered by the same IoTLogIQ field data OS that runs WorkerIQ, RotaryIQ, AssetIQ, and the rest.
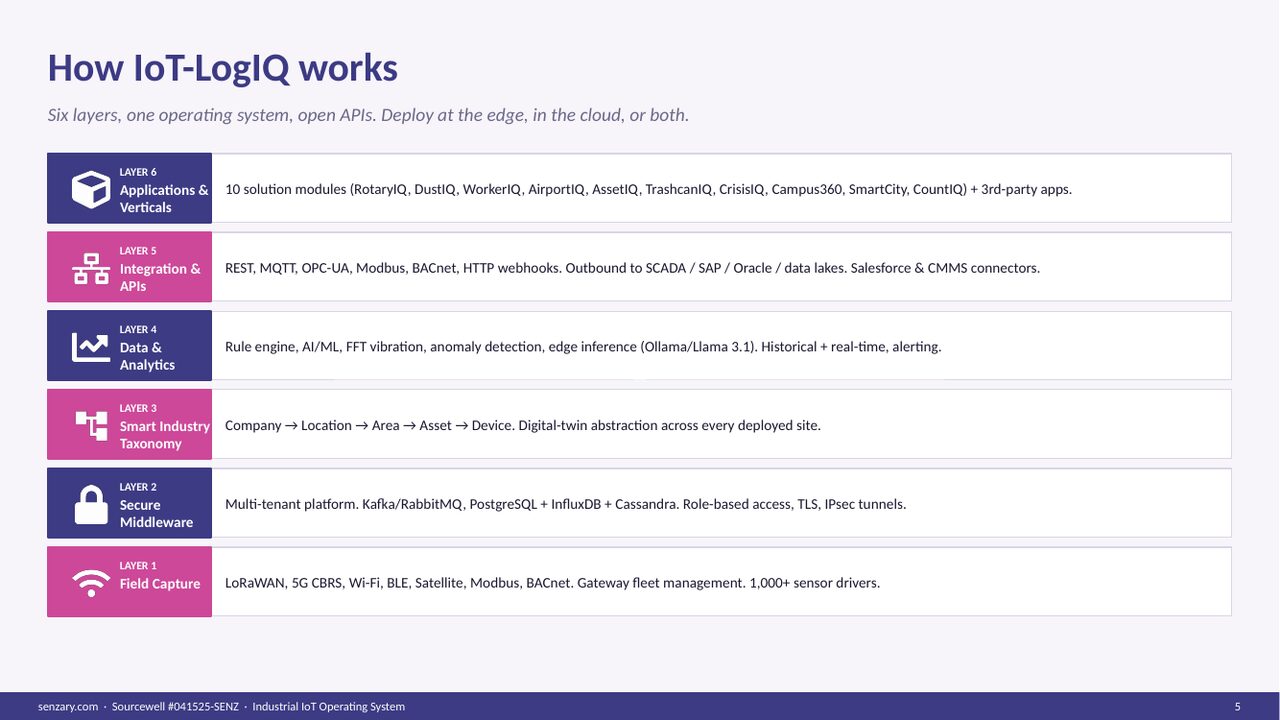
The IoTLogIQ stack — six layers, one taxonomy, one view.
ONE TAXONOMY ACROSS EVERY DEPLOYMENT.
Industrial Observability isn't a dashboard product. It's the Smart Industry Taxonomy — Tenant → Customer → Location → Area → System → Machine → Device → Telemetry — applied uniformly across every IQ module, every plant, every customer. Once a sensor is in the hierarchy, every dashboard, KPI rollup, automated report, and AI query is automatic.
WHAT YOU GET OUT OF THE BOX
Multi-Tenant Hierarchy
Each customer is a tenant. Each tenant has locations, areas, systems, machines, and devices. Role-based access at every level — Plant Manager sees their plant, Executive sees all plants.
Live Telemetry + Alarms
Sub-second updates from every sensor in every plant. Alarm rules at machine, system, or area level. Audit trail on every event.
Dashboards Per Persona
Plant Manager, Maintenance Lead, HSE, Operations Director, CIO — each persona gets a curated dashboard. No analyst required to build them.
Cross-Plant Rollups
OEE, MTBF, energy intensity, safety incidents — rolled up automatically from device → machine → system → area → plant → tenant. Apples-to-apples comparisons across geographies.
Automated Reporting
Scheduled PDF / Excel / Slack / Email delivery of shift handoffs, compliance reports, monthly executive summaries. Configure once, run forever.
GenAI Natural Language
Ask 'which gearboxes are showing early-stage wear at Plant 3?' in plain English. The Senzary MCP server queries the live data and returns the answer. Industry-first.
THE TAXONOMY IN ACTION
IN PRODUCTION
Started with one battery plant. Same taxonomy, same dashboards, scaled to five without re-platforming.
DustIQ, RotaryIQ, AssetIQ, and EnergyIQ all in the same observability pane. One login, one taxonomy.
Plant-wide rotating equipment health in a single live dashboard.
PILOT IN 30 DAYS.
One area. One owner. One problem. Live data on the call, not slides.